eFRAMS - Graphical Reporting
New charting functionality is now available within eFRAMS as of version 3.7.1.
A number of key reports (refer list below) have been augmented with graphical capability, which provides improved usability and interpretation of the displayed information. These enhancements are part of ongoing Optus improvement programs in response to customer requests for improved reporting presentation.
Additionally, a range of new reports have been added, some offering further drill down to assist with more detailed analysis of the displayed information. For queries, or assistance please contact your Optus Service Delivery representative.
The following reports now include graphical and tabular representation of the data:
- Bill Summary Bill Summary
- Bill Summary By Supplier
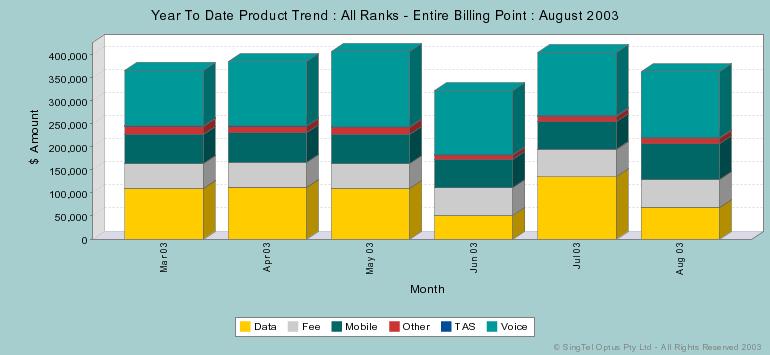
- Year To Date Product Trend *
- Year To Date By Total Spend *
- Bill Analysis Call Profile *
- Bill Analysis Frequently Dialled Destinations
- Inventory Summary By Mobile *
* New Report
|